
Cracking the Code: How Manchester City F.C. managed to break into the Premier League Elite
Chapter 3: Revenue streams
The revenue is separated into three market segments (figure 3):
- Matchday
- Broadcasting
- Commercial interests
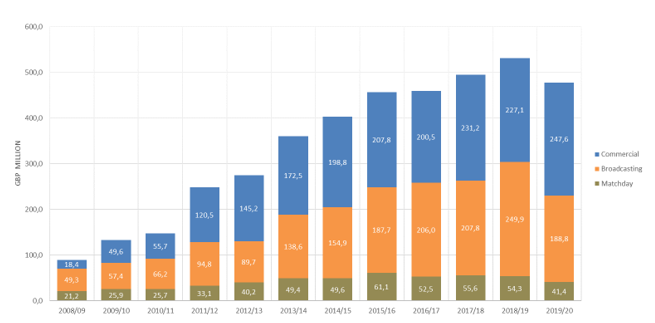
Figure 3: Manchester City revenue streams 2008-2020 (Statista, 2021b)
The drop in revenues for the 2019/20 season is due to the COVID-19 pandemic. When the fiscal year ended on June 30, 2020 Manchester City still participated in three tournaments.
According to their annual report (Manchester City, 2020) all income from matches played after June 30th, 2020 were deferred to the 2020-21 accounts. Income from player sales were also postponed to the next season.
Matchday revenue
In the treble-trophy 2018-19 season matchday revenue only accounted for 11% of Manchester City’s total, down from 24% in 2009. This includes all income from ticket sales, hospitality, on venue sales, and all other activities on the day of the match.
Matchday revenue is connected to the size of the stadium and the supporter fan base. In many ways Premier League clubs in the short run operate as monopolists towards their own fan base. Supporters pick their club for life and clubs are mostly free to set prices as they like.
The biggest effect on revenue streams of clubs like Manchester City and LFC are related to the broadcasting and commercial income. Participating in the UEFA Champions League and experiencing domestic success increases the exposure internationally and by that the value of the brand.
In 10 years, Manchester City have been transformed from a club focused on matchday performances to an internationally recognisable brand.
Broadcasting revenue
The increase in broadcasting revenue for Premier League has made English football an expanding market, growing from GBP 1.7bn in 2007-10, to all-time high GBP 5.1bn in 2016-19.
The deals are negotiated for a three-year period and is listed in the table below (Gazapo, 2020). The latest deal saw a considerable 10% drop in income to the Premier League.
Due to uncertainties introduced by the COVID-19 pandemic the current deal has been extended to 2025 under the same terms (Lake, 2021).
| Period | Years | Broadcaster | Games | Total cost (GBP) | Cost per game (GBP) |
| 1997-01 | 4 | Sky | 240 | 670m | 2.8m |
| 2001-04 | 3 | Sky | 330 | 1200m | 3.6m |
| 2004-07 | 3 | Sky | 414 | 1000m | 2.5m |
| 2007-10 | 3 | Sky/Setanta | 414 | 1700m | 4.1m |
| 2010-13 | 3 | Sky/ESPN | 414 | 1800m | 4.3m |
| 2013-16 | 3 | Sky/BT | 462 | 3000m | 6.5m |
| 2016-19 | 3 | Sky/BT | 504 | 5100m | 10.2m |
| 2019-22 | 3 | Sky/BT/Amazon | 600 | 4554m | 7.6m |
Table 1: Premier League broadcasting deals 1997-2021
Figure 4 shows that broadcasting (TV, prize money, Internet) constituted 47% of Manchester City’s total revenue in 2018/19. 16% of the income comes from UEFA broadcasting, and separates Manchester City from clubs who only participate domestically.
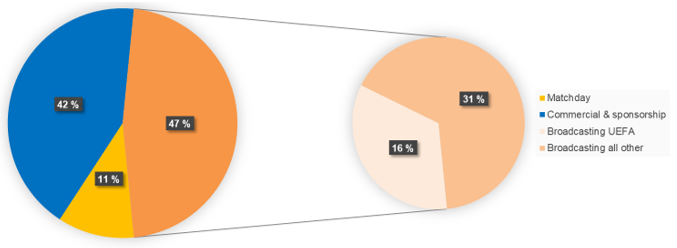
Figure 4: Manchester City Broadcasting income sources 2018/19 (Manchester City, 2019)
Income scenarios from different competitions for a Premier League-club is shown in table 2 below, ranging from plain entry (left) to winner of all competitions (right).
If a club finishes 20th in Premier League, gets knocked out of both the FA Cup and Carabao League Cup in the first match, and do not participate in Champions League they will collect approximately GBP 96 million in broadcasting (prize money) even if they don’t win a single game.
In comparison Leeds United had a total turnover of GBP 54 million during their 2019/20 campaign which won them promotion to the Premier League (Fame, 2021a).
| Entry | Top 8 | Top 4 | Runner up | Winner | |
| English Premier League | 96,50 | 134,00 | 143,00 | 148,00 | 153,00 |
| UEFA Champions League | 13,10 | 44,30 | 55,00 | 70,00 | 74,00 |
| FA-Cup | 0,02 | 0,26 | 1,10 | 2,40 | 3,30 |
| Carabao League-Cup | 0,00 | 0,00 | 0,00 | 0,08 | 0,13 |
| Total | 109,62 | 178,56 | 199,70 | 218,08 | 227,43 |
Table 2: Broadcasting income scenarios 2021 (GBP millions) (Adapted from: Planetfootball (2021), Sportingnews (2021), Sportingfree (2021), Goal (2021))
The income for a club positioned 20th in the Premier League is around GBP 96 million compared to GBP 134 million for a top 8th position. The income may increase with the number of TV-screenings during the season.
Clubs claiming a top 4 spot in Premier League will qualify for the quarter finals (top 8) of the Champions League and gain 40% more revenue from broadcasting than a club claiming 8th position in the Premier League and not having qualified to play in Europe. Income from the domestic cups is neglectable, although winning the FA-cup means qualification to play in Europa League.
When Manchester City won all three domestic trophies in 2019 and reached the quarter final of the Champions League, they collected a total of GBP 249.9 million in broadcasting money (figure 3).
Commercial revenue
In 2008, Manchester City’s commercial revenue counted for less than the income from matchday (figure 3). Since then, the revenue generated from Broadcasting and Commercial has increased rapidly, fuelled by subsequent appearances in the Champions League which substantially increased the brands commercial value outside the UK.
In figure 5 we see that commercial revenue constituted 42% of Manchester City’s revenue. This includes partnership and other commercial contracts like Etihad Airways for the jersey sponsorship (GBP 45m) and naming rights to the stadium (GBP 21m). A 10-year kit deal with Puma worth GBP 65m per year was signed in 2019 (Sportspro, 2020).
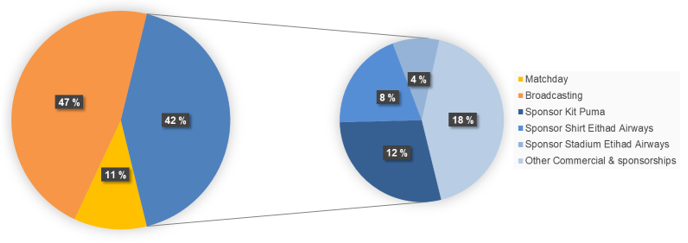
Figure 5: Manchester City Commercial & sponsorships sources 2018/19
In addition, there is revenue from a long list of smaller sponsors, plus sales of merchandise world-wide and from related activities such as concerts, conferences, and events.
Related Posts


About The Author
svenn
Established the Manchester City supporters' homepage in November 1994 which at the time was the first ever Web-page dedicated to Manchester City. Became part of the MCIVTA-team in the early days, and is still maintainer of the site mcivta.com which has merged the newsletter and the Supporters homepage into one service.