Cracking the Code: How Manchester City F.C. managed to break into the Premier League Elite
Chapter 7: Vulnerability, Cost and Exposure
There are three large groups of costs related to football clubs (Soriano, 2012:27):
- Operating costs related to running the club and its facilities, training, travel, scouting, commercial expenses, and management costs. These are quasi-fixed cost that need to be optimised and kept as low as possible.
- Salaries to players. Compared to the total revenue of all Premier League-clubs in 2019, 61% of that went into salaries, for Manchester City the figure was 59% (Deloitte, 2020). Player salaries are often split into fixed salaries and variable bonuses related to the revenue they generate. Soriano (2012:141-142) describes the salary structure at Barcelona FC. From his examples about one third of the players maximum salaries were connected to variable bonuses.
- Amortisation is cost related to investment in players licences. The transfer fee paid for a player are amortised over the years corresponding to the length of the players contract, normally 3-5 years. If the player then gets sold the club must account for the profit from the selling price minus the outstanding amortisation.
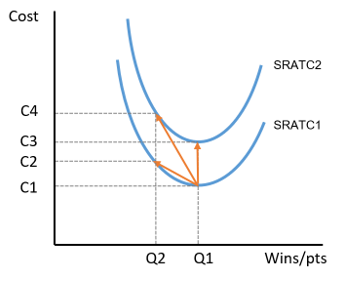
Burdened with a lot of fixed and quasi-fixed cost from player salaries and amortisation and with the law of diminishing returns for introducing more workers in the short run the clubs average total cost (SRATC) curve will be steep and exposed to type 1 vulnerability (figure 9). A change in points/wins from the optimal Q1 to Q2 in figure will increase the SRATC from C1 to C2.

Figure 9: SRATC curve of Premier League teams
In addition, clubs are exposed to type 2 vulnerability represented by increase in input costs. When buying new players, or renegotiating contracts with existing players the input cost of producing the wins/pts may increase substantially. This moves the SRATC upwards from Q1,C1 to Q1,C3. And if the team is then not able to deliver the necessary wins/points both vulnerabilities will come into effect and the SRATC will move to Q2,C4.
To reduce exposure to type 2 vulnerability Manchester City seems to focus on signing young players that can stay with the club for 10+ years. They also develop their own players through their Academy. And by keeping the same manager and staff for a long period, installing stability and control within the club.
Exposure to type 1 vulnerability can be reduced by not aiming too high. By setting achievable goals and developing healthy cost-structures and transfer policies clubs can be economically sustainable even from a mid-table position.
Macroeconomic exposure
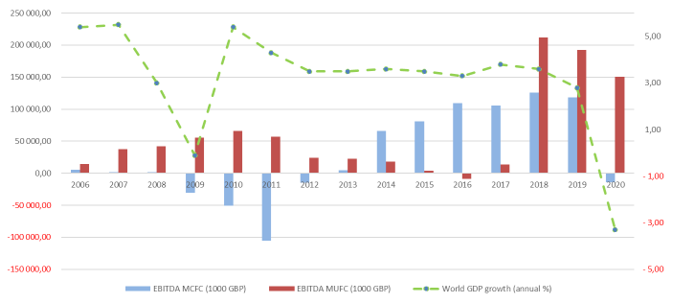
The EBITDA for Manchester City and Manchester United is shown in figure 10 is vital for the club’s ability to invest in players to strengthen their competitiveness.
Compared to the annual change in real world GDP for the same period (IMF, 2021) we observe that the economic downfall in 2008-09 did not have any major impact on the EBIDA of Manchester United (Fame, 2021c). While Manchester City at the time underwent a period of reconstruction and heavy investments leading to negative figures in 2009-11 (Fame, 2021b).

Figure 10: Change in EBITDA compared to change in world GDP
The long-term sponsorship and broadcasting deals seems to postpone the effects from changes in GDP. But in the long run macroeconomic changes will have an effect. After a stable period in terms of world GDP from 2012 onward the Broadcasting deal was reduced in 2019 and as a result both clubs experience a reduction in EBITDA from 2018-2019.
Changes in interest rates can have an effect if the club is heavily reliant on long term debt. In 2019 Manchester United had a gearing ratio of 617% which make them highly exposed to changes to the interest rate. Manchester City had a gearing ratio of 17% and is not so exposed.
In figure 10 we observe a sharp increase in the EBITDA of Manchester United in 2018-2020 fuelled by increased broadcasting and sponsorship deals after qualifying for the quarter finals of the Champions League. In contrast they did not reach the same level in the years 2012-2016 and were subject to type 1 vulnerability.
Non-macroeconomic exposure
Income from broadcasting and sponsorships are protected by long term contracts and little exposed to non-macroeconomic changes in the short run.
However, a drop in consumers income will have an influence on the commercial income, as demand for matchday ticket and merchandise sales will go down. Being an international brand does provide some protection from local changes in GDP.
The COVID-19 pandemic is an extreme example of exposure as matchday revenue plummeted when spectators were not allowed inside the stadium.
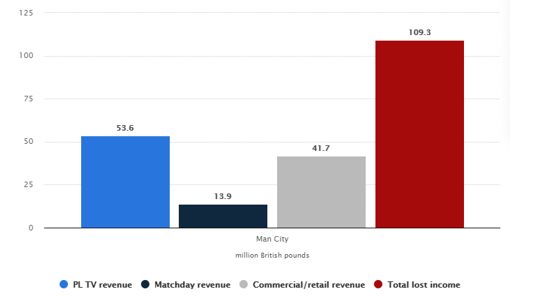
Figure 11 shows the estimated lost income of Manchester City in 2020 due to the COVID-19 pandemic (GBP millions). Most of the loss in TV and commercial revenue is recovered in the next fiscal year, while matchday revenue is harder to recoup since attendances was not allowed at the delayed matches.

Figure 11: Distribution of estimated lost income 2019-20 due to COVID-19 (Statista, 2021a)
The drop in EBITDA in 2020 is explained by delayed income due to the pandemic, loss of matchday revenue and delayed players sales. In their annual report the club explains that the years 2020 and 2021 must be seen together to get the full picture (Manchester City, 2020).


