Cracking the Code: How Manchester City F.C. managed to break into the Premier League Elite
Chapter 4: Market exposure
The oligopoly effect
In the Premier League all clubs seem to have an equal shot at the top prize, and as shown in table 2 even the lowest positioned club is guaranteed a decent share of the dividend. But with no cap on salaries this represents a “strategic hell” when it comes to competing for and investing in new players and securing commercial revenue.
Clubs winning trophies and finishing top 4 on a regular basis will break out of the competitive market and get access to bigger revenues which allow them able to pay higher wages to attract better players, leading to more wins and further increase their income.
This leads to an oligopoly effect which can be demonstrated by running a Herfindahl Index (HI) (Kwoka, 1985) on the three major domestic trophies in England (Premier League, FA-cup and League-cup) for the period 2006-2021.
| Premier League | FA Cup | Carabao League Cup | Total | Percent | (HI) Square | |
| Manchester City | 5 | 2 | 6 | 13 | 31,71 | 1005,35 |
| Chelsea | 3 | 5 | 2 | 10 | 24,39 | 594,88 |
| Manchester United | 5 | 1 | 3 | 9 | 21,95 | 481,86 |
| Arsenal | 4 | 4 | 9,76 | 95,18 | ||
| Liverpool | 1 | 1 | 2 | 4,88 | 23,80 | |
| Leicester City | 1 | 1 | 2 | 4,88 | 23,80 | |
| Tottenham Hotspur | 1 | 1 | 2,44 | 5,95 | ||
| 15 | 13 | 13 | 41 | 100,00 | 2230,81 |
Table 3: Domestic trophies won by Premier League-clubs between 2006-2021.
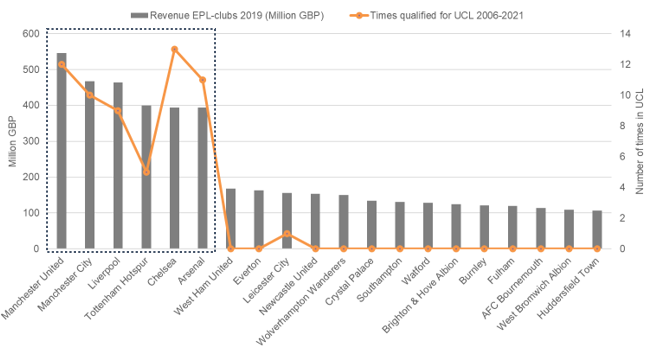
This gives an HI of 2231 which indicates that Premier League is an oligopoly with a few clubs dominating the market and high barriers for entry into that elite. Figure 6 below show the connection between total revenue and the number of qualifications to Champions League between 2006 and 2021.

Figure 6: Premier League clubs’ total revenue 2019 and number of times qualified for Champions League since 2006.


